Category Archives: Trailers

Trailers for 2016-17 School year

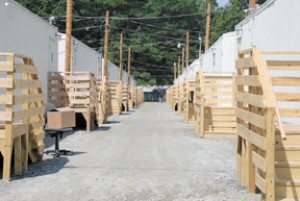
In March, the DeKalb Board of Education approved $2.5 million for the purchase of trailers. The Cross Keys redistricting plan will result in a net reduction of approximately 15 trailer classrooms in the Cross Keys Cluster.
Modular and Portable Classroom Deployment Plan
This “Modular and Portable Classroom Deployment Plan” is for the 2016-17 School Year and is subject to change based upon feedback from the Allotments Department, Principals and Regional Superintendents.
Trailer Types:

  • Singles – Single classroom units approximately 14’ x 45’ which are most commonly used throughout the District.
  • Quads – Quads contain four individual classrooms and a set of Boys/Girls Restrooms. These units are approximately 66’ x 66’ and are primarily used at middle and high schools.
  • Restroom Unit – A standalone set of a set of Boys/Girls Restroom used in conjunction with single classroom units.

Trailers Removed
(19 singles) from the following locations:

Region School Trailers Total
1 Cary Reynolds ES remove 5 singles (25 to 20) *
1 Dresden ES remove 6 singles (26 to 20) *
3 Dunaire ES remove 3 singles (12 to 9)
1 Montclair ES remove 4 singles (18 to 14) *
2 Sagamore Hills ES remove 1 single (6 to 5)

*Note: These schools were included in the Cross Keys Redistricting Plan. Staff originally estimated the possible reduction of approximately 30 modular/portable classroom units. This summer, staff will remove 15 units from these three schools, according to the administration, due to the public input regarding families who may move to alternative housing locations in order to remain within their current school’s attendance area in lieu of being redistricted.
Trailers Added
(47 singles and 3 quads) to the following school locations due to enrollment

Region School Trailers Total
1 Ashford Park ES add 3 singles (5 to 8)
2 Briarlake ES add 2 singles (1 to 3)
5 Canby Lane ES add 2 singles (0 to 2)
1 Dunwoody ES add 4 singles (1 to 5)
1 Dunwoody HS add 1 single (4 to 5)
3 Eldridge Miller ES add 5 singles (0 to 5)
4 Fairington ES add 1 single (2 to 3)
5 Flat Shoals ES add 3 singles (0 to 3)
2 Hawthorne ES add 1 single (1 to 2)
2 Henderson Mill ES add 2 singles (5 to 7)
2 Idlewood ES add 2 singles (7 to 9)
ISC (Midway) add 2 singles (0 to 2)
2 Laurel Ridge ES add 2 singles (0 to 2)
2 Livsey ES add 1 single (6 to 7)
2 McLendon ES add 3 singles (0 to 3)
1 Montgomery ES add 2 singles (5 to 7)
2 Oak Grove ES add 1 single (3 to 4)
4 Panola Way ES add 3 singles (0 to 3)
5 Peachcrest ES add 5 singles (0 to 5)
1 Peachtree Charter MS add 1 quad (12 to 16)
1 Sequoyah MS add 2 quads (17 to 25)
4 Stoneview ES add 2 singles (2 to 4)

Trailers added or removed
(21 singles and 1 restroom) due to construction activity at the following schools:

  • Clifton ES, remove 3 singles (Students, faculty and staff will be temporarily moving to former Terry Mill ES this fall)
  • Redan HS, remove 5 singles (New addition will be completed this fall)
  • Terry Mill ES, add 5 singles (3 singles from Clifton ES and 2 singles from Redan HS)
  • Miller Gove MS, add 16 singles and 1 restroom unit (3 singles from Redan HS and 13 new singles plus 1 new restroom)

Additionally
To support the above plan, the district has ordered new modular/portable classroom units (52 singles, 3 quads, 1 restroom):

  • 14 for construction: 13 new singles and 1 new restroom for construction at Miller Grove MS ($510,349)
  • 42 for capacity: 39 new singles and 3 new quads for capacity and replacement of existing units ($1,964,709)

The district is in the process of disposing of/auctioning 22 singles that are beyond their useful life.

Projected FY2016 Enrollment And Utilization

DeKalb Schools is in the process of preparing for next year.  Teacher contracts have gone out and the first Public Budget Input Hearing is Wednesday at 5:45pm.  How many teachers and trailers we need will depend on the enrollment and capacity of each school.  Here are the projected enrollments of each school by district/region.
Note: This data was produced by DeKalb County School District.
.pdf link icon Enrollment/Capacity Numbers in Oct 2014
.pdf link icon Projected Oct 2015 Enrollment (Provided by Dan Drake)
Region 1

Reg School Capacity FY15 Enroll Proj FY16 Enroll Util Diff
1 Ashford Park ES 563 574 565 100% -9
1 Austin ES 616 637 642 104% 5
1 Cary Reynolds ES 749 1163 1,259 168% 96
1 Chamblee HS 1695 1307 1,365 81% 58
1 Chamblee MS 1077 890 923 86% 33
1 Chesnut ES 570 452 457 80% 5
1 Cross Keys HS 1215 1333 1,559 128% 226
1 Dresden ES 850 1183 1,307 154% 124
1 Dunwoody ES 973 979 1,034 106% 55
1 Dunwoody HS 1,403 1,679 1,700 121% 21
1 Hightower ES 635 832 833 131% 1
1 Huntley Hills ES 532 493 541 102% 48
1 Kingsley ES 500 568 556 111% -12
1 Kittredge ES 590 458 476 81% 18
1 Montclair ES 792 1128 1173 148% 45
1 Montgomery ES 699 754 785 112% 31
1 Oakcliff ES 752 730 724 96% -6
1 Peachtree Charter MS 1212 1398 1,485 123% 87
1 Sequoyah MS 1266 1416 1,506 119% 90
1 Vanderlyn ES 576 714 697 121% -17
1 Woodward ES 826 1041 1,041 126% 0

Region 2

Reg School Capacity FY15 Enroll Proj FY16 Enroll Util Diff
2 Avondale ES 757 490 512 68% 22
2 Briar Vista ES 525 458 465 89% 7
2 Briarlake ES 465 401 412 89% 11
2 Brockett ES 539 480 498 92% 18
2 DeKalb ES of the Arts at Terry Mill 614 533 549 89% 16
2 DeKalb School of the Arts (DSA) 608 370 388 64% 18
2 Druid Hills HS 1,206 1,386 1,340 111% -46
2 Druid Hills MS 1206 903 868 72% -35
2 Elizabeth Andrews HS 971 674 674 69% 0
2 Evansdale ES 643 601 603 94% 2
2 Fernbank ES 850 605 600 71% -5
2 Hawthorne ES 492 398 418 85% 20
2 Henderson Mill ES 551 609 641 116% 32
2 Henderson MS 1170 1580 1,603 137% 23
2 Idlewood ES 882 953 1,001 113% 48
2 Lakeside HS 1,698 2,053 2,126 125% 73
2 Laurel Ridge ES 491 448 494 101% 46
2 Livsey ES 379 373 356 94% -17
2 McLendon ES 562 392 466 83% 74
2 McNair, Ronald E. Discovery Learning Acad 997 931 954 96% 23
2 Midvale ES 511 434 443 87% 9
2 Oak Grove ES 643 629 641 100% 12
2 Pleasantdale ES 667 745 720 108% -25
2 Robert Shaw ES 546 479 543 99% 64
2 Sagamore Hills ES 440 437 427 97% -10
2 Smoke Rise ES 565 438 430 76% -8
2 Tucker HS 1,644 1,851 1,925 117% 74
2 Tucker MS 1254 1263 1,220 97% -43

Region 3

Reg School Capacity FY15 Enroll Proj FY16 Enroll Util Diff
3 Allgood ES 690 649 676 98% 27
3 Champion MS 801 788 778 97% -10
3 Clarkston HS 1206 1544 1,573 130% 29
3 Dunaire ES 761 868 915 120% 47
3 Eldridge Miller ES 610 575 593 97% 18
3 Freedom MS 1380 1235 1,294 94% 59
3 Hambrick ES 742 675 708 95% 33
3 Indian Creek ES 959 1087 1,092 114% 5
3 Jolly ES 805 900 928 115% 28
3 Pine Ridge ES 969 631 601 62% -30
3 Princeton ES 1078 924 928 86% 4
3 Redan ES 756 507 532 70% 25
3 Redan HS 1,074 1,114 1,066 99% -48
3 Redan MS 1410 762 735 52% -27
3 Rock Chapel ES 691 501 478 69% -23
3 Rockbridge ES 576 429 416 72% -13
3 Shadow Rock ES 771 662 660 86% -2
3 Stephenson MS 1482 1007 993 67% -14
3 StephensonHS 2,058 1,593 1,570 76% -23
3 Stone Mill ES 736 569 553 75% -16
3 Stone Mountain ES 619 570 564 91% -6
3 Stone Mountain MS 1428 918 838 59% -80
3 Stone Mountain HS 1,086 1,082 1,015 93% -67
3 Wynbrooke ES 980 758 825 84% 67

Region 4

Reg School Capacity FY15 Enroll Proj FY16 Enroll Util Diff
4 Arabia Mountain HS 1586 1287 1,330 84% 43
4 Bob Mathis ES 531 462 525 99% 63
4 Bouie, E. L. ES 890 736 735 83% -1
4 Browns Mill ES 673 710 740 110% 30
4 Chapel Hill ES 792 635 676 85% 41
4 Chapel Hill MS 1170 860 777 66% -83
4 Fairington ES 691 711 708 102% -3
4 Flat Rock ES 1097 1057 1,071 98% 14
4 Lithonia MS 1326 1158 1,103 83% -55
4 Lithonia HS 1,254 1,317 1,452 116% 135
4 M.L.King,Jr.,HS 1,910 1,684 1,679 88% -5
4 Marbut ES 969 772 744 77% -28
4 Miller Grove MS 1161 976 909 78% -67
4 Miller Grove HS 1,799 1,557 1,507 84% -50
4 Murphey Candler ES 716 526 527 74% 1
4 Narvie Harris ES 934 858 857 92% -1
4 Panola Way ES 890 861 887 100% 26
4 Rainbow ES 688 425 426 62% 1
4 Salem MS 1215 1093 1,076 89% -17
4 Southwest DeKalb HS 1,880 1285 1,281 68% -4
4 Stoneview ES 833 846 870 104% 24
4 Woodridge ES 554 586 619 112% 33

Region 5

Reg School Capacity FY15 Enroll Proj FY16 Enroll Util Diff
5 Bethune, Mary McLeod MS 1335 903 867 65% -36
5 Canby Lane ES 734 656 653 89% -3
5 Cedar Grove ES 685 596 596 87% 0
5 Cedar Grove HS 1163 1022 1,058 91% 36
5 Cedar Grove MS 1416 865 825 58% -40
5 Clifton ES 702 372 369 53% -3
5 Columbia ES 774 597 598 77% 1
5 Columbia HS 1208 1216 1,156 96% -60
5 Columbia MS 1386 939 885 64% -54
5 Flat Shoals ES 632 577 603 95% 26
5 Kelley Lake ES 484 360 354 73% -6
5 Knollwood ES 565 379
5 McNair MS 1461 699 697 48% -2
5 McNair HS 1524 801 796 52% -5
5 Meadowview ES 477 392 405 85% 13
5 Midway ES 800 590 1,507 188% 917
5 Oak View ES 1012 817 871 86% 54
5 Rowland ES 565 616 651 115% 35
5 Snapfinger ES 958 832 858 90% 26
5 Toney ES 661 426 462 70% 36
5 Towers HS 1,244 1,003 986 79% -17
5 Wadsworth ES 666 244 275 41% 31