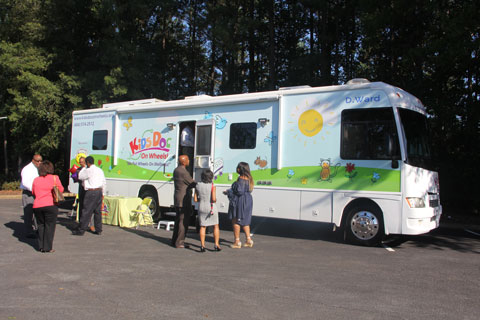
DeKalb Schools is partnering with physicians to provide access to medical services at some schools via a new mobile health unit.

Kids Doc on Wheels is a mobile health clinic. The medical van will allow students to receive medical intervention on site during the school day. The intended purpose of this service is to provide consistent medical care and help keep students in school. Children from ages 0 – 18 may be seen for physicals, vaccinations, asthma and allergy management, wellness exams, and general sick visits.
There is no cost to the district for participation in this initiative. Parents must give consent for students to receive treatment. Medicaid and private insurance will be accepted for payment. A sliding fee will be offered to families that qualify.
The following four schools in South DeKalb will participate in the first phase of this initiative:
- Flat Rock ES
- Snapfinger ES
- Panola Way ES
- Fairington ES
The schools were chosen based on the chronic illness reports compiled in school clinics and research provided by external health agencies identifying the zip codes of students with frequent emergency room visits. The van will report to the schools on a rotational basis. School health staff will help to coordinate the student appointments.
DeKalb Schools will monitor the first phase of implementation to see if there is room for expansion into other regions of the District.
Student Attendance Rates – School Year 2016-2017
Research conducted by the Georgia Department of Education (GaDOE) concluded that a student’s attendance significantly impacts graduation rates and academic performance. Data indicates that missing more than five days of school each year, regardless of the cause, begins to impact student academic performance and starts shaping attitudes about school. Chronically truant students are not the only students negatively impacted by absences.
Student Attendance Rate = 100 * (number of students with Absences < 6 / Total number of enrolled students)
| Region | School | Average Student Attendance |
|---|---|---|
| 4 | Arabia Mountain HS | 87% |
| 1 | Dunwoody HS | 83% |
| 1 | Chamblee Charter HS | 83% |
| 3 | Stepehenson HS | 78% |
| 2 | Lakeside HS | 78% |
| 5 | Cedar Grove HS | 67% |
| 2 | Druid Hills HS | 65% |
| 3 | Clarkston HS | 61% |
| 2 | Tucker HS | 59% |
| 4 | MLK, Jr. HS | 58% |
| 4 | Southwest DeKalb HS | 58% |
| 5 | McNair HS | 52% |
| 3 | Stone Mountain HS | 50% |
| 4 | Miller Grove HS | 48% |
| 4 | Lithonia HS | 47% |
| 3 | Redan HS | 46% |
| 5 | Columbia HS | 45% |
| 1 | Cross Keys HS | 41% |
| 5 | Towers HS | 37% |


 “Extremism in defense of liberty is no vice. Moderation in pursuit of justice is no virtue.”
Please explain the table. Specifically, define what the numbers in the column “Average Student Attendance” mean.
Student Attendance Rate = 100 * (number of students with Absences < 6 / Total number of enrolled students)